Your Overview
The Overview is the page CloudMonitor opens on and the one you’ll glance at most. It answers the FinOps questions in decision order: can I trust the data, where will spend land, what is unexpected, what needs action, and which Cost Groups explain the movement?
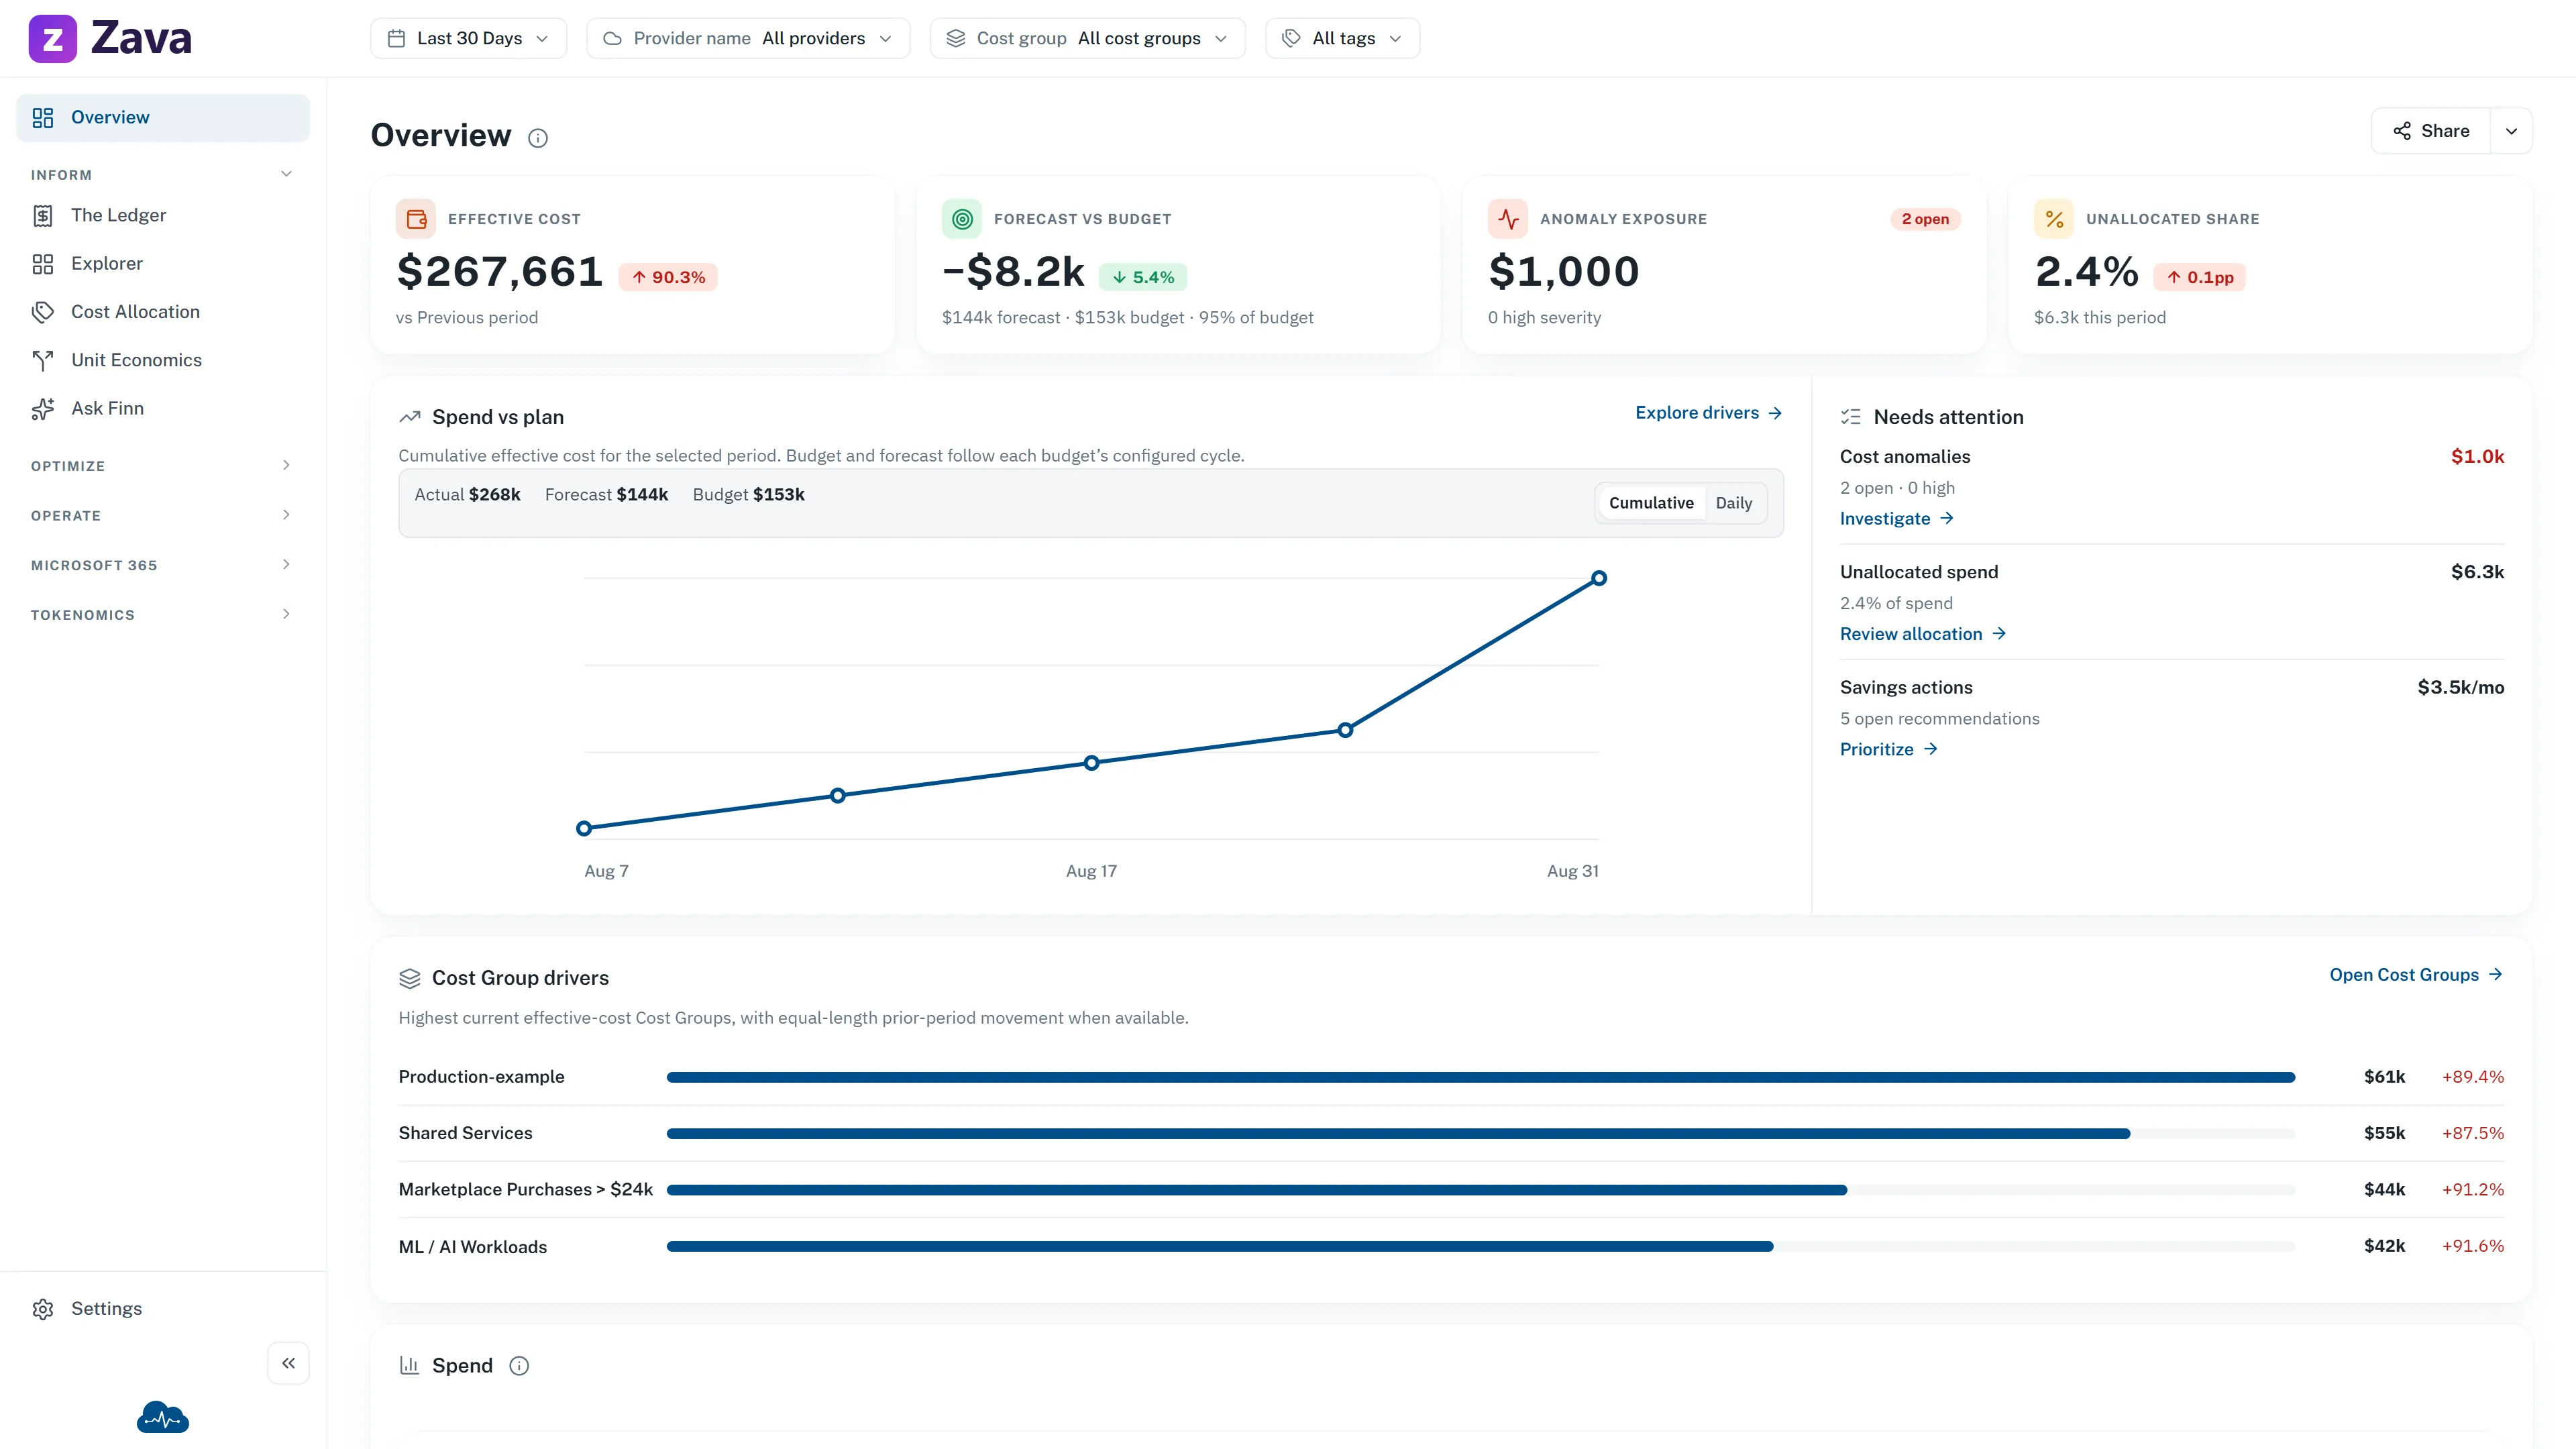
The sample data and branding in this image are from the public demo. Your figures, available actions and visible widgets depend on your data, access and configured features.
What’s on it out of the box
Section titled “What’s on it out of the box”First comes a trust strip. It can show:
- Data current when the latest successful processing is less than 24 hours old.
- Data delayed when the latest known success is older.
- Processing freshness unavailable when no trustworthy success time can be read. This never turns into a green state by assumption.
- Data through and Last successful processing when those timestamps exist.
- The reporting currency. In the standalone Workload app this is the browser-configured display currency, not a tenant-authoritative reporting setting.
- Allocated, but only when you may also read the corresponding Unallocated value.
Then come the decision numbers:
- Effective cost: the selected period’s amortized cost.
- Forecast vs budget: Fabric App evaluates each applicable budget over that budget’s configured cycle. Budgets with incompatible cycle lengths are not combined. Workload has no safe aggregate budget read, so it states that no comparable budget is available.
- Anomaly exposure: open anomaly impact, open cases and high-severity context.
- Unallocated share: unallocated amount, its share of effective cost and prior-period percentage-point movement, when you have allocation access.
Unit economics joins them only when CloudMonitor can calculate an honest rate for the scope you are viewing. With one Cost Group selected, it uses that group’s primary business quantity. With no Cost Group selected, it can use a quantity defined for the whole organization. It never combines unlike quantities from several Cost Groups into one rate.
The figure uses the latest completed calendar month that has both cost and a supplied value. It also names the quantity and whether its value was entered, imported or supplied through an API. If no valid rate exists, the widget and its entry in Add widget are absent rather than shown as an empty card.
The full-width FinOps focus card puts Spend vs plan before Needs attention. On desktop, Spend vs plan gets twice the width. On a narrow screen they stack in that reading order. Cost Group drivers follows with up to four highest-current-cost groups, their prior-period movement and a direct action to open each Cost Group when available. The final full-width default row is Spend over time, where you can stack effective cost by a dimension, change the interval, and switch the chart form.
Each number carries its own explanation: hover it to see exactly what’s being counted. That matters more than it sounds, because “spend” has several defensible definitions and this tells you which one you’re looking at.
Reading Budget health
Section titled “Reading Budget health”With one applicable budget, Budget health shows that budget’s current spend, forecast, and alert position for its own cycle. With more than one, it shows a Budget portfolio instead: totals are context across independently evaluated budgets, not one combined commitment. An individual alert names the budget that needs attention; open Budgets & Forecasts for its threshold and detail.
Spend, plan and budget periods
Section titled “Spend, plan and budget periods”The Spend vs plan chart is always cumulative effective cost for the selected period. Budget and forecast are separately labeled summaries, not lines on the selected-period chart. Fabric App keeps each budget on its native monthly, quarterly or annual cycle rather than rebuilding or pro-rating it to the Overview period.
When Provider or Tags filters narrow actual spend but cannot equivalently narrow the budget population, plan figures are marked unavailable. This is deliberate: an unrelated plan value would look precise while answering a different question.
Anomaly values at the display limit
Section titled “Anomaly values at the display limit”Overview uses the inbox’s newest-first anomaly source, narrowed by authorized Cost Groups and Period before its 200-row display cap. Below the cap, its count and impact are exact. When the source reaches the cap, the displayed open count gains a +, impact becomes at least, and the row states that the source was capped. Those are lower bounds after triage, not complete totals.
A zero remains meaningful only when the authorized anomaly read succeeds with no open cases.
The filters apply
Section titled “The filters apply”Period, provider, cost group and virtual tags all narrow the Overview. Scoping it to one cost group turns it into that team’s home page, which is the fastest way to answer “how are we doing?” for a part of the business.
Not every source carries every filter. The widget explanation tells you which filters it honors. Open anomalies follow the selected Period. Native-cycle budgets do not become the selected Period, and Provider or Tags filters can make their plan context unavailable.
Unit economics uses effective cost and the latest completed month with a supplied business value, so Period and cost-basis changes do not re-scope it. Provider and Virtual Tags also do not narrow the figure because the business value has no provider or tag attribution. Selecting exactly one Cost Group does change the scope; selecting several hides the widget rather than mixing their quantities.
What Needs attention means
Section titled “What Needs attention means”Needs attention can show budget risk, cost anomalies, unallocated spend and savings actions. Each available signal resolves independently and links directly to its destination when you may open it. If anomaly, allocation or savings data is unavailable, that signal says so without hiding the other rows. A signal you are not permitted to read is absent rather than shown as a revealing placeholder.
Making it yours
Section titled “Making it yours”At the bottom, Make this page yours. is the quick way into customization. Choose widgets enters the same draft edit mode as the header and opens the widget picker immediately. It does not change or save the layout by itself.
Edit homepage turns on arranging mode. From there:
- Add widget opens a searchable visual gallery in expandable business categories. Each card has a safe sample preview, its purpose, selected state, and direct Add/Remove action. Spend vs plan uses a real-widget sample screenshot; other previews remain illustrations. None use current customer values.
- Select a preview for a larger view explaining the widget’s purpose, source screen, and supported global filters.
- Drag or use keyboard controls to reorder. Small widgets share rows; large analysis widgets keep a row to themselves.
- The × on a widget removes it.
- Reset to default puts it back.
Add/Remove choices stay inside the picker until Apply. Closing the picker before Apply discards them. Apply updates only the homepage edit draft. Done commits that draft; homepage Cancel restores what you started with. The bottom prompt is hidden during editing because Add widget is already in the header.
Your layout is yours alone: it doesn’t change what anyone else sees, and it follows you between devices. Existing saved layouts remain unchanged when the shipped default changes. New FinOps widgets are not injected automatically. The current default includes Unit economics, but the page closes up without a hole whenever that rate is unavailable. Confirm Reset to default only when you want to discard your arrangement and adopt the current product default.
Access changes what is visible
Section titled “Access changes what is visible”In Fabric App, every summary is calculated from your readable Cost Groups. Unallocated and the inverse Allocated percentage share one permission because either reveals the other. Restricted KPIs, attention rows and actions are removed rather than calculated tenant-wide.
Standalone Workload currently uses one static full-access administrator identity for the connected model. Its owner/member preview modes are presentation previews, not production authorization. Its Overview is fixed, so it does not show the customization prompt or an additional Spend over time widget.
If it looks empty
Section titled “If it looks empty”Check the Period first: a window with no data produces an empty page that is working correctly. A dash or unavailable message is different from zero. It can mean processing evidence is missing, no comparable native-cycle budget exists, a source failed independently, or access prevents the value from being shown. A successful zero-anomaly read is a genuine all-clear and says so.