The Cost Groups report
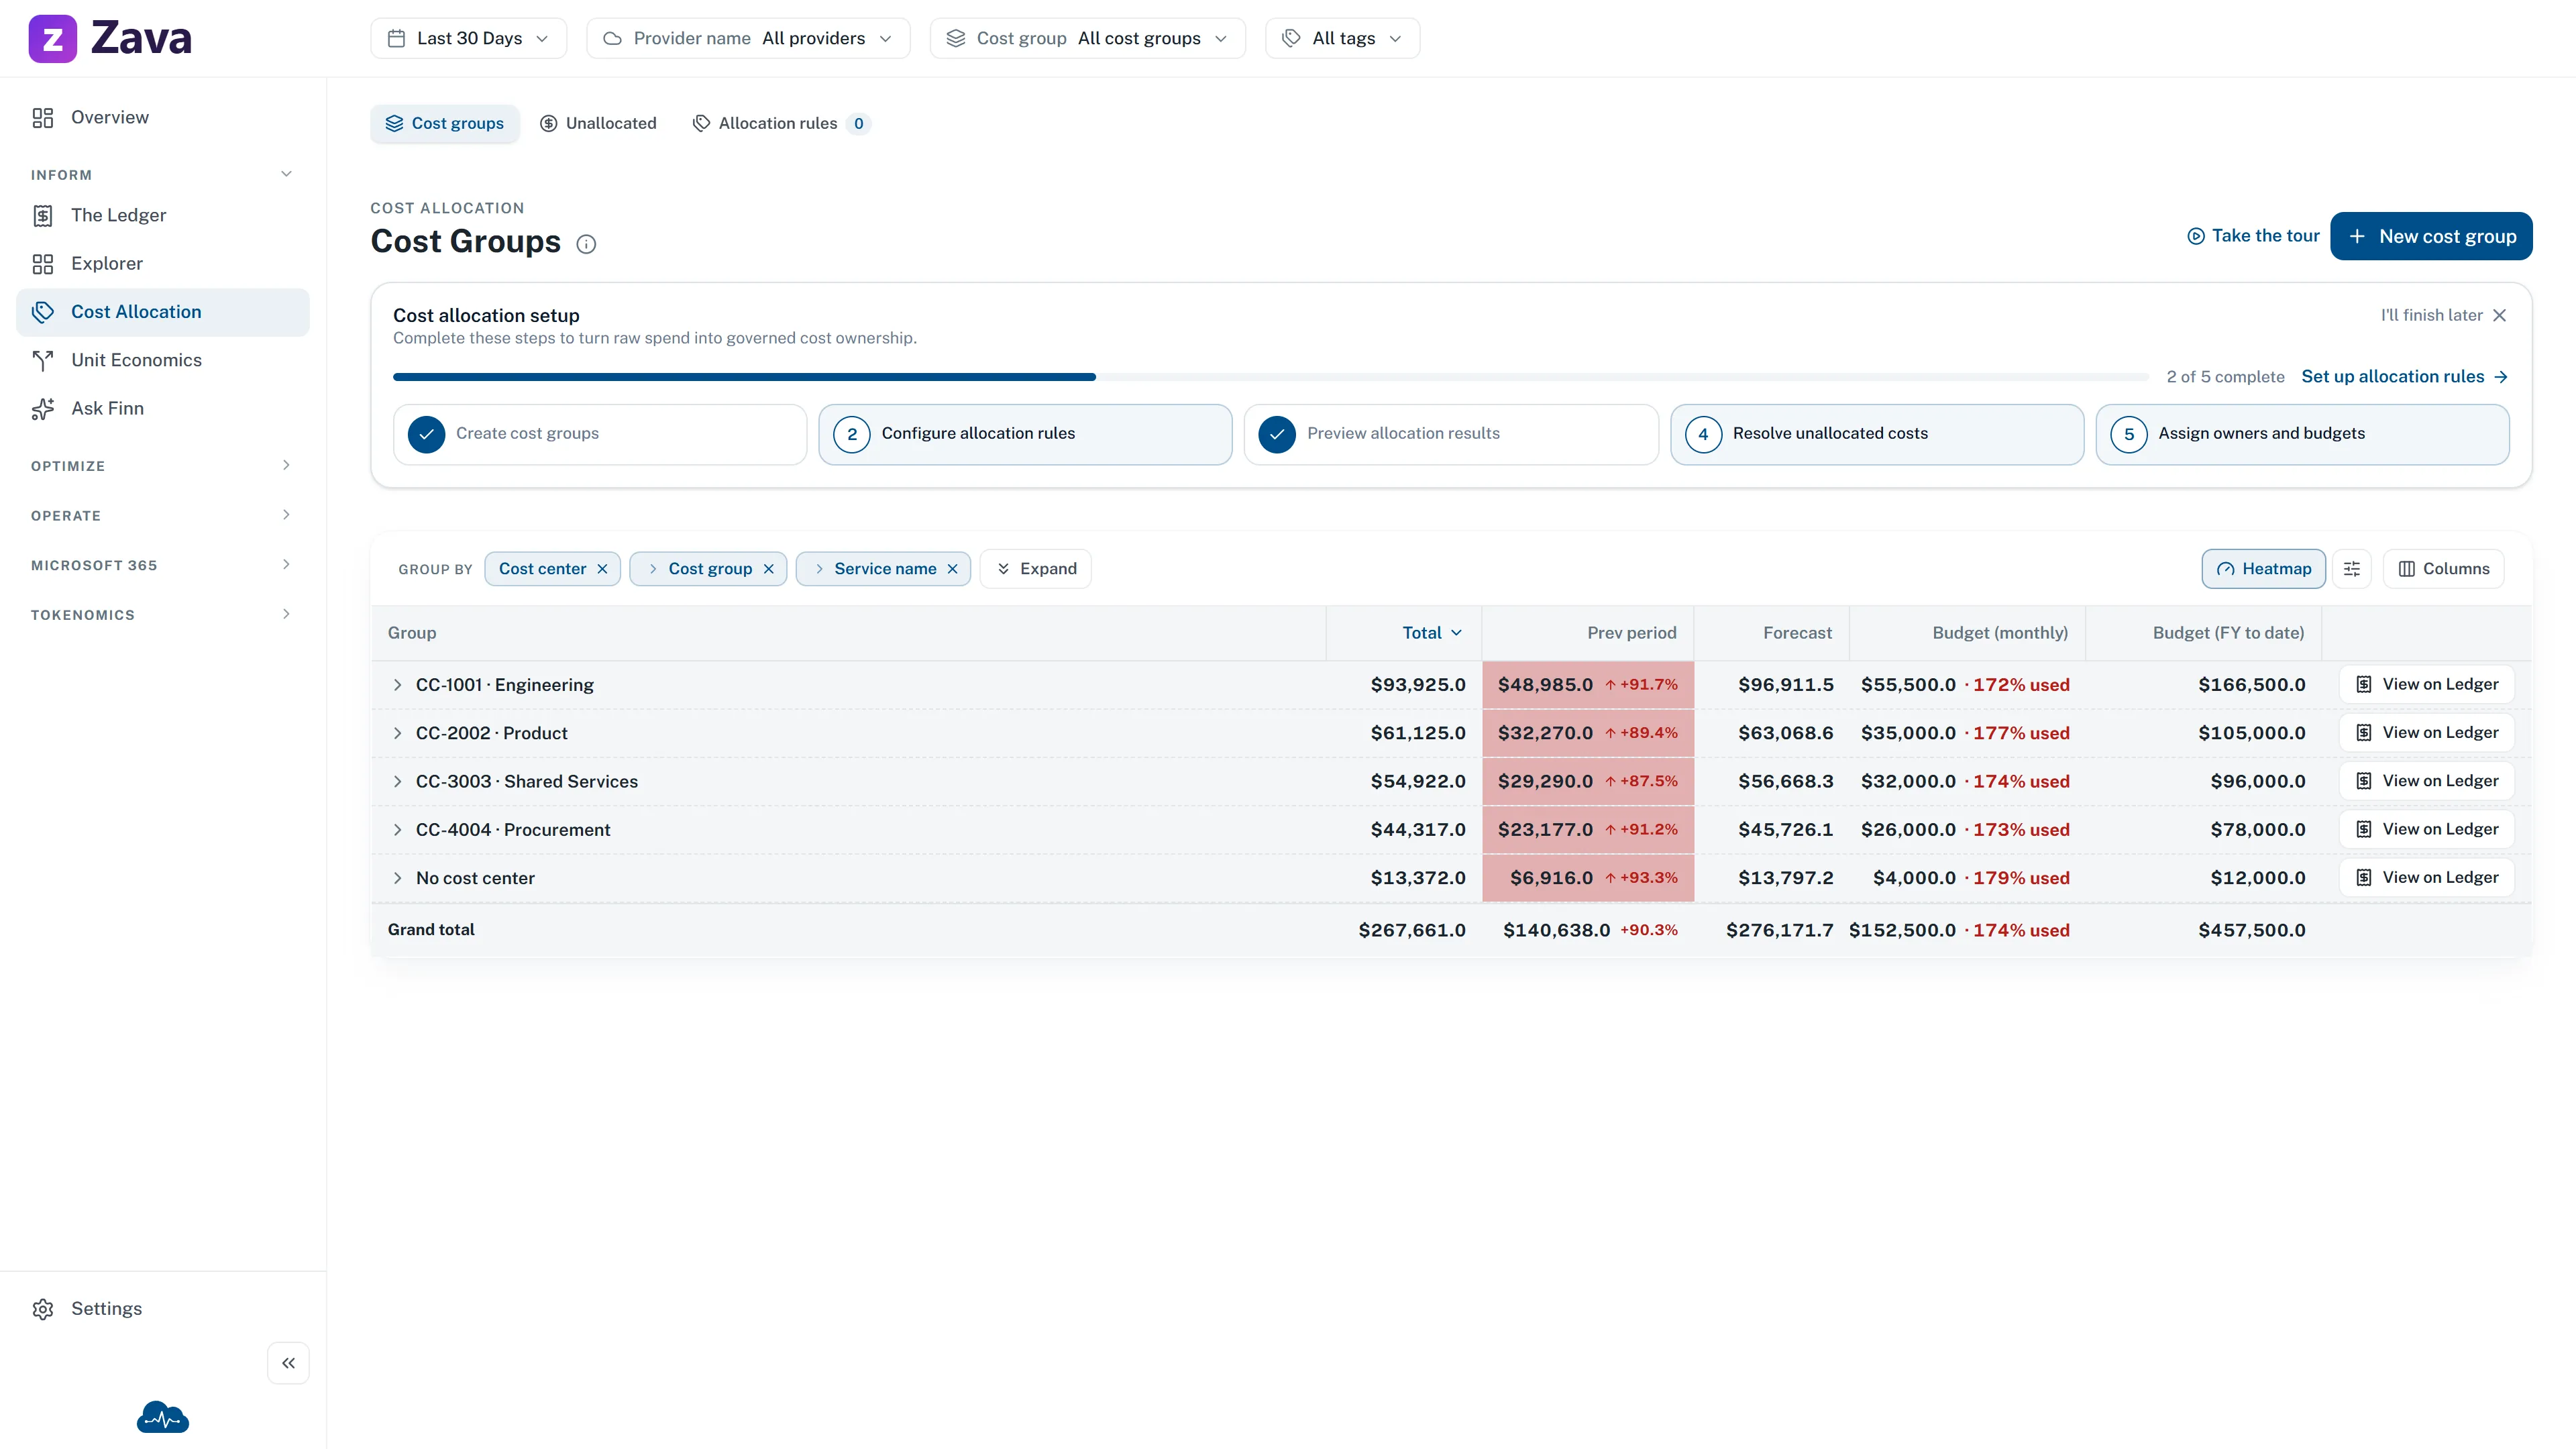
Every cost group’s spend for the period, side by side. This is the report you open before a budget conversation or a chargeback run. It is also the management list: the actions on each row expand according to your role, and admins can start a new group from the page header.
What’s in the table
Section titled “What’s in the table”It’s a cost grid, so it groups and drills like every other. On top of the spend figures it pulls in information from the cost groups themselves:
- Budget and budget year-to-date
- Owners: who’s accountable
- Last updated
If any group has a cost center set, the table rolls up by cost center first, then by group. That gives finance a view that lines up with the accounting system rather than with CloudMonitor’s own hierarchy.
Markers worth knowing:
- System: the built-in Unallocated group. It can be renamed but never removed, because every charge has to land somewhere.
- The short code beside a name: used by allocation rules to route spend by naming convention.
”Requires repair” on a budget
Section titled “”Requires repair” on a budget”A budget stored in a different currency from your workspace’s reporting currency shows a dash and a Requires repair badge instead of a figure.
CloudMonitor never converts currencies, so it won’t guess. Someone needs to re-enter the amount in the current reporting currency. See the currency note in effective cost vs billed cost.
Getting to one group
Section titled “Getting to one group”Use the labeled action on a row to open its group. The arrow beside that action opens More actions for group name, where Open cost group is available alongside any management actions your role allows. This takes you to inside a cost group: the full picture for that one group, including its budget, members and history.
If you can manage the group, the same menu offers editing.
What you can see
Section titled “What you can see”Admins see every group. Everyone else sees the groups they belong to. If this report looks emptier than you expect, that’s usually why. See Roles and access.
Filters
Section titled “Filters”Every global filter applies. Note the interaction: filtering to one cost group and then opening this report gives you one row, which is rarely what you want. Clear the cost group filter to compare groups against each other.
Exporting to Excel
Section titled “Exporting to Excel”Export Excel, above the table, downloads the cost allocation report for a chargeback run, laid out like the Power BI export from CloudMonitor V1. It has one row per cost group, highest cost first, with these columns:
- Cost Group: the group’s code and name.
- Av. Daily Cost: the period’s cost divided by the days that have cost data so far.
- Period Cost: cost for the selected period and cost type.
- Monthly Billed Cost: billed cost for the latest month with data, up to its latest day.
- Budget and Budget YTD: the monthly budget, and that budget times the months of the current financial year that the period touches. A September period counts one month; the last 30 days from 31 August count two. Budget YTD is blank for a period in an earlier financial year.
- Forecast: the month-to-date billed cost run on to the end of the month.
- Subscription, Resource Groups and Resources: how many of each in your resource inventory had cost in the period.
A Total row follows the cost groups. Its counts include each subscription, resource group or resource once, even when two groups share one. Below it, the file lists the filters that were applied: the period, cost type, currency and any provider, cost group, tag or table filter.
The file keeps the same columns however you group the table or choose its columns, and it only holds the cost groups you can see here. Monthly Billed Cost and Forecast cover the latest month whatever period you pick, as they did in V1. In demo mode those two columns and the counts are blank.
The file’s Period Cost total always matches the table’s Total. If it ever differed, CloudMonitor would show Excel export failed. and download nothing.