See the Fabric capacity charge in full Azure context.
CloudMonitor reads capacity-level Fabric F SKU charges from your Azure FOCUS export. It shows billed and effective cost with period trends; CU consumption, throttling, and workload allocation are not connected yet.
- 01Billed cost
- 02Effective cost
- 03Period trend
Fabric capacity appears in CloudMonitor as an Azure resource charge. Use that live billing record to explain what the capacity costs and how it changes over time. Use Microsoft's Fabric apps for current CU health, throttling, workspace, item, domain, and user detail.
- Reads the real capacity-level F SKU charge from the connected Azure FOCUS export.
- Keeps billed cost and effective cost distinct for invoice and operational questions.
- Labels workspace and workload chargeback as a sample-data preview.
- Does not change Fabric capacity settings or workloads.
Live billing view
Track the F SKU charge with the rest of Azure.
CloudMonitor shows the Fabric capacity resource in the same Azure cost context as other services. Review billed cost for invoice reconciliation, effective cost for amortized analysis, and the period trend before investigating a change.
- Capacity-level charge from the Azure FOCUS export
- Billed and effective cost kept as separate measures
- Period trend beside the wider Azure estate
Sample-data preview
Treat workspace chargeback as a preview, not connected data.
The public demo illustrates how CU consumption could be allocated across workspaces and items. CloudMonitor does not have the production telemetry feed required to populate that fine-grained view with customer data today.
- Sample CU figures for the preview only
- No live workspace, item, domain, or user allocation in CloudMonitor yet
- No live throttling telemetry in this connection
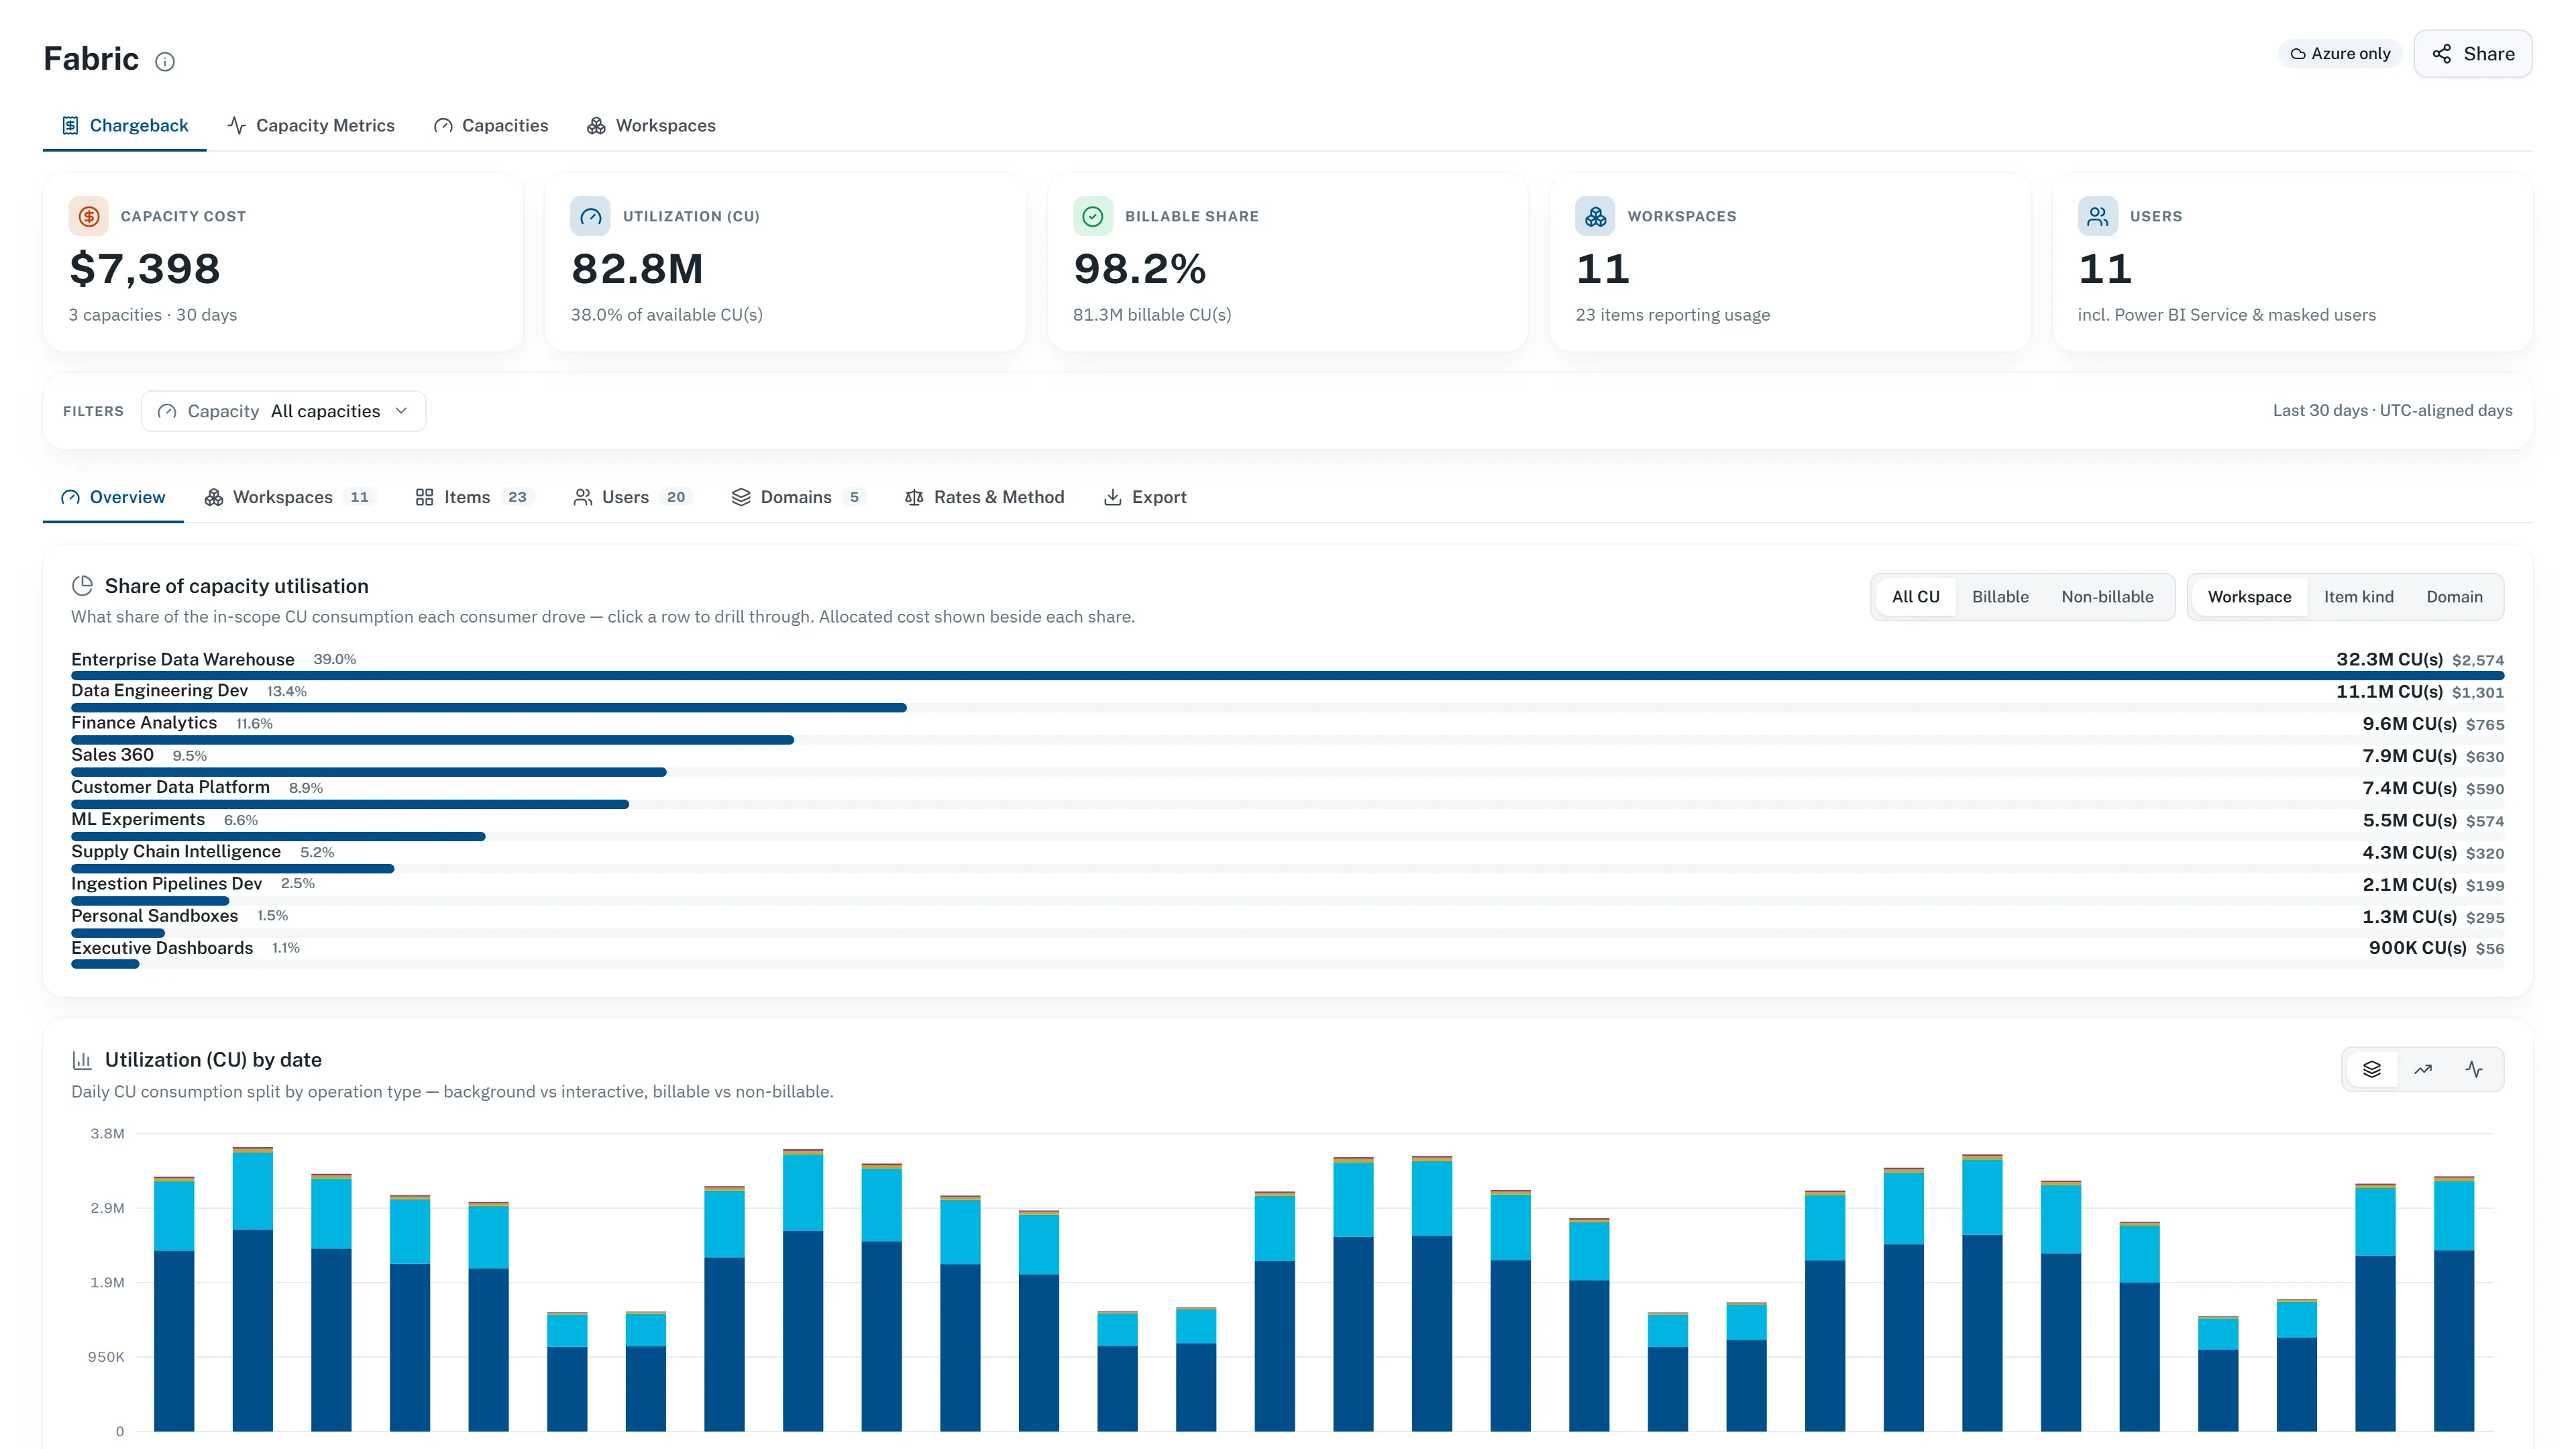
Sample data · fine-grained Fabric telemetry is not connected
Operational boundary
Use Microsoft's Fabric apps for live CU evidence.
Microsoft's Fabric Capacity Metrics app provides current capacity health, compute, storage, and throttling detail. Its Fabric Chargeback app attributes CU consumption to workspaces, items, domains, and users. CloudMonitor adds the capacity charge to the wider Azure cost view.
- CloudMonitor: live capacity-level cost in Azure context
- Capacity Metrics: live capacity health and performance telemetry
- Fabric Chargeback: fine-grained CU allocation from Microsoft
Capacity cost is live when it arrives through the connected Azure FOCUS export. Fine-grained CU consumption, throttling, and workload allocation are not. CloudMonitor never substitutes sample figures when a customer feed is missing.
Use the Microsoft Fabric monitoring page for the current source boundary and links to Microsoft’s Capacity Metrics and Fabric Chargeback guidance.
More data platforms
Other integrations like this.
Put the Fabric capacity charge into your Azure review.
Connect Azure billing for the live F SKU charge, and keep sample CU allocation separate from production evidence.