The Explorer
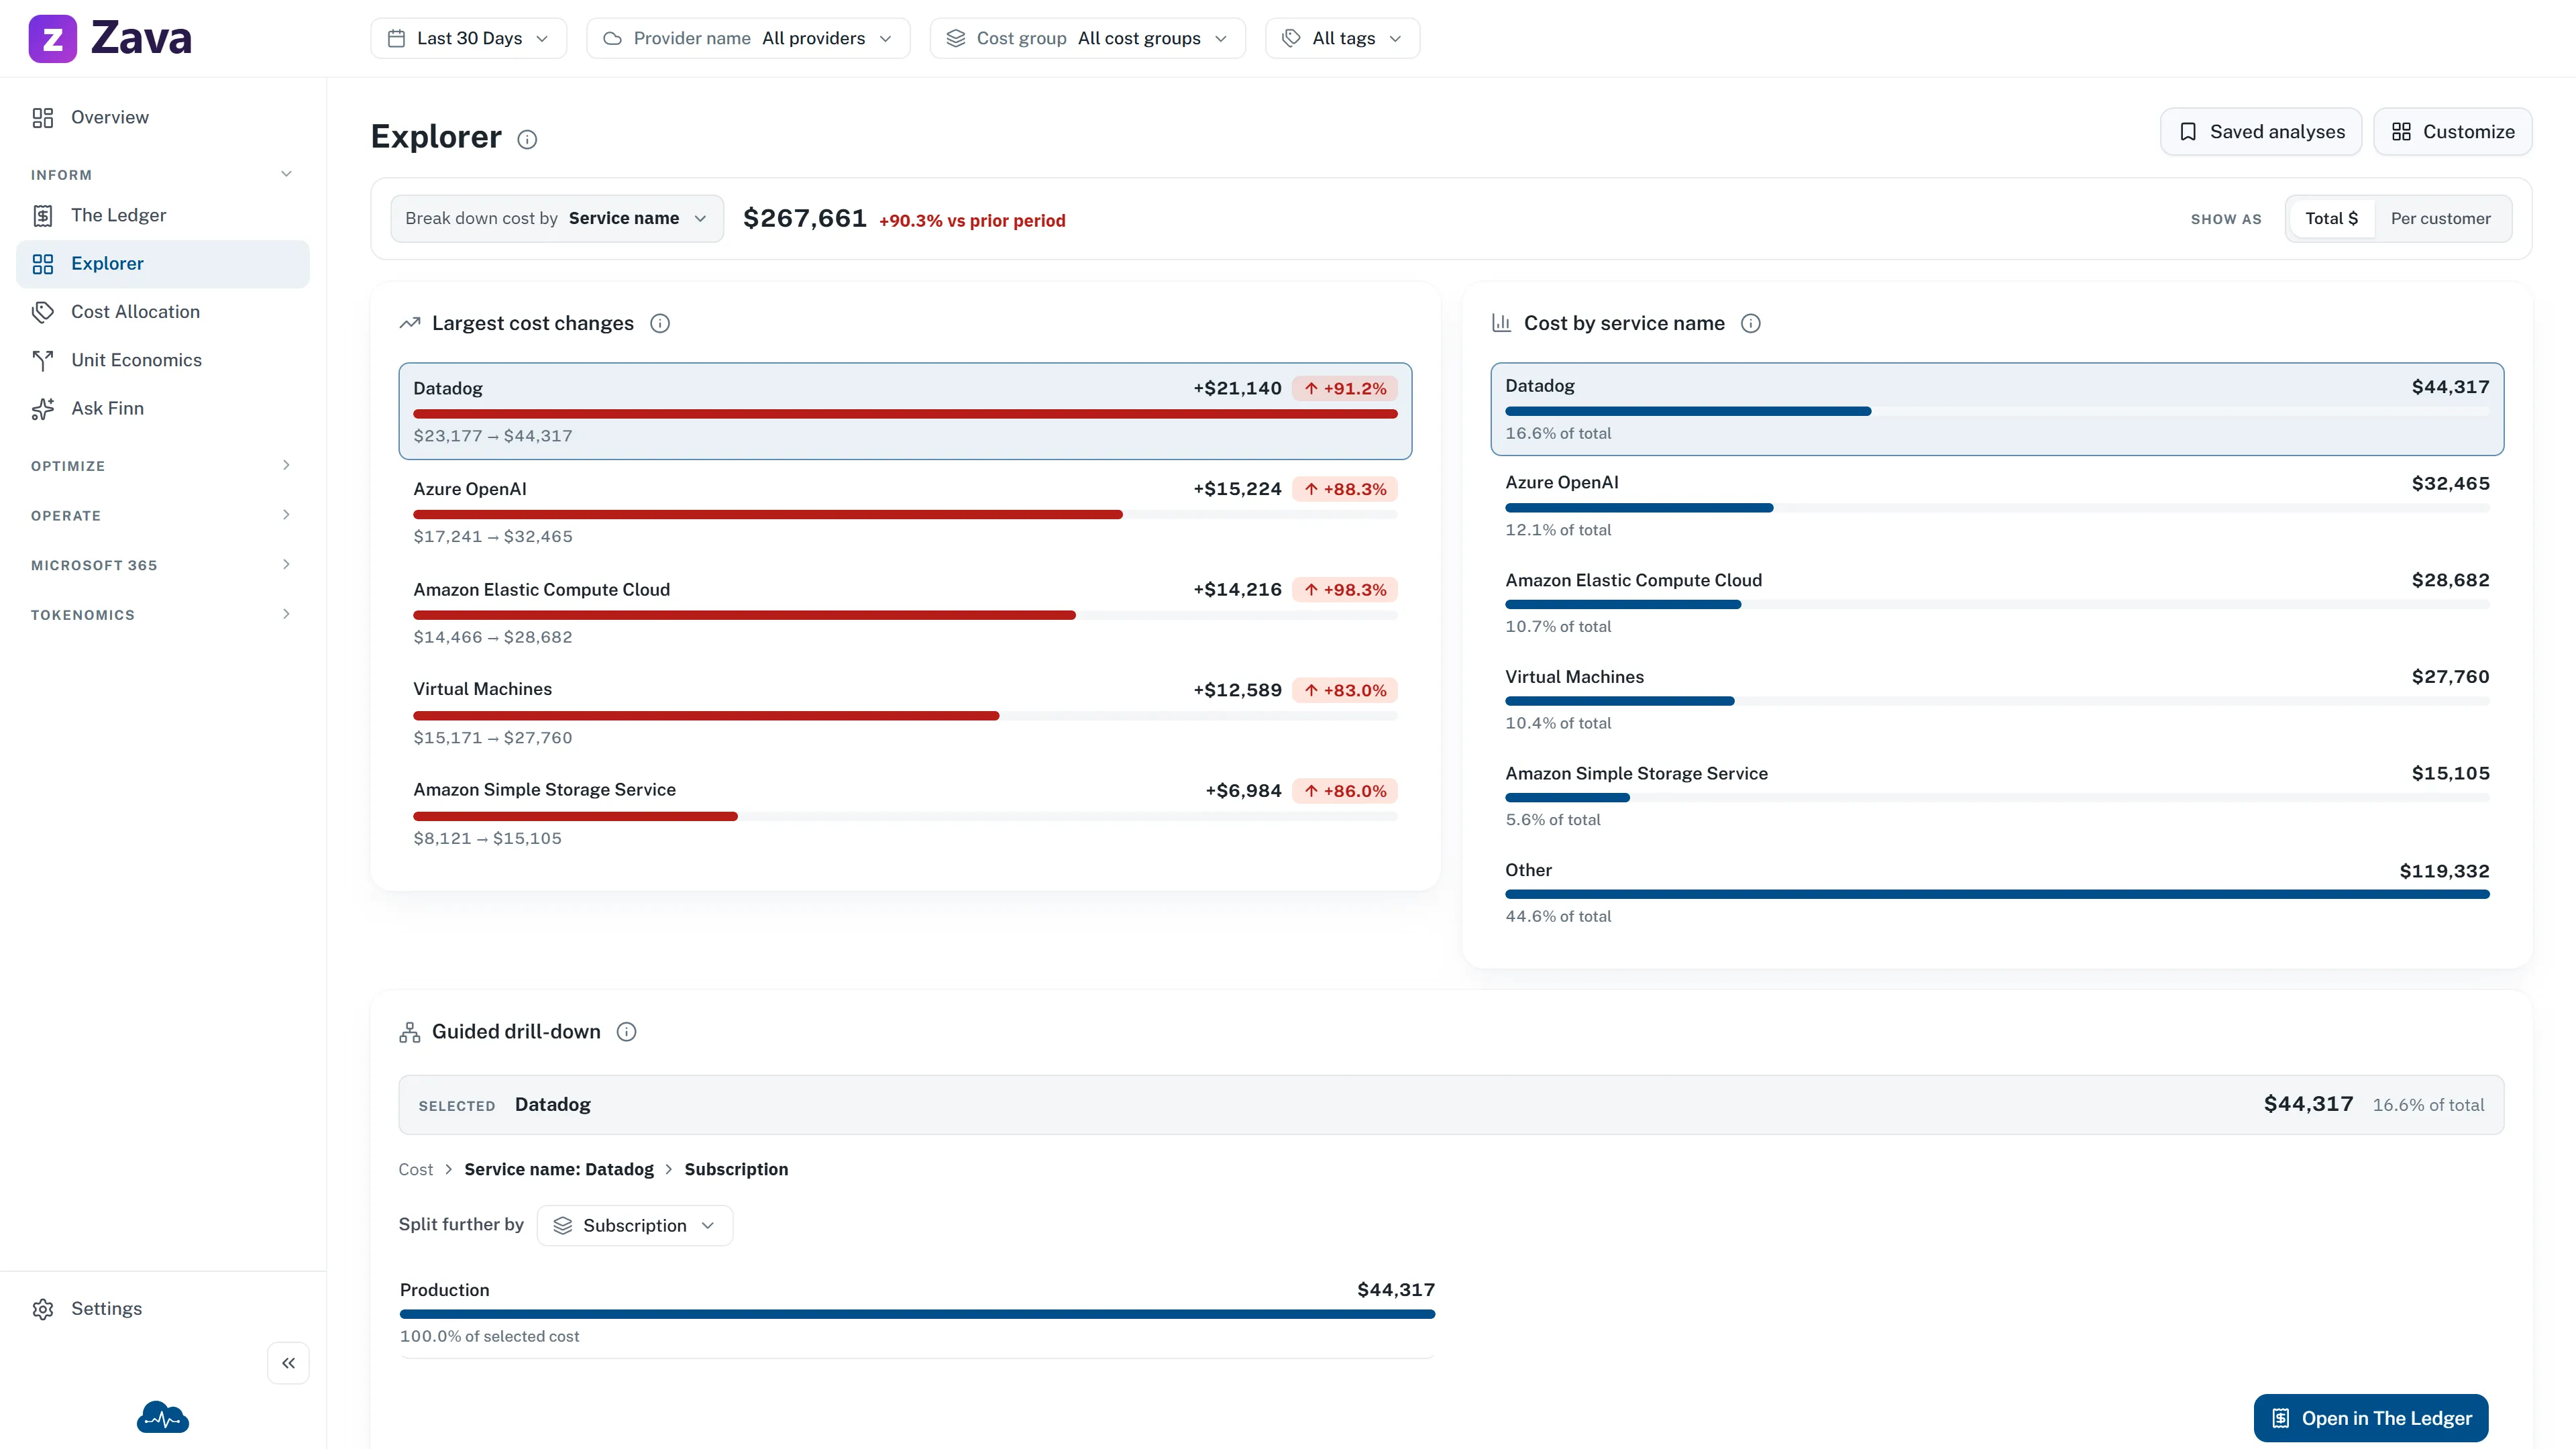
The Explorer is for the question nobody anticipated. It gives you one short path:
Compare the largest costs and changes, then select a value to investigate it further.
Where The Ledger is a table you group, the Explorer is a guided analysis. It reads the same scoped rows, so the totals reconcile.
Choose what appears
Section titled “Choose what appears”Explorer starts with Largest cost changes beside Cost by service name, then a full-width Guided drill-down. The first pair answers what moved and where cost is concentrated before you spend time drilling. On a narrow screen, they stack in the same order.
- Select Customize in the page header, or Choose widgets in the Make this page yours. prompt at the bottom. Both open the same panel.
- Search or browse the visual cards. Each card shows a safe sample preview, its purpose, and current selected state. Select the preview for a larger detail view.
- Add or remove widgets and use the move controls to set their order.
- Select Save layout once.
Cancel, Escape, and closing the panel discard its pending changes. The example images never use your current cost data. Layout changes are personal; they do not change the analysis saved under Saved analyses. If you hide every widget, the page keeps a clear Customize recovery action.
The picker keeps every Explorer analysis that CloudMonitor has shipped. The simple default uses Largest cost changes, Cost breakdown, and Guided drill-down. You can also add the original Cost analysis chart or map, Biggest movers list, standalone Breakdown, full Decomposition tree, Cost over time, and Monthly average cost. Removing a widget from the default never removes it from your choices or from an existing saved layout.
Monthly average cost excludes the current and any partial calendar month. It uses complete months inside the active Period when there are any. If that Period is too short, it uses recorded complete months from the last 12 months and says so below the value.
Your Explorer layout and Saved analyses are separate. Changing or resetting either one leaves the other unchanged. Your layout follows your account across sessions and devices. In demo mode, changes last only for the current session.
While at least one widget is shown, the analysis and saved-analysis controls stay on the page. Demo mode also shows the rate control. The map switch appears when an active cost view supports it and the page is broken down by Region.
Shape the analysis
Section titled “Shape the analysis”Break down cost by. Open the searchable dimension menu and choose one stable dimension. The same choice drives both summary cards and the guided drill-down. When the top bar already pins one cost group, Cost group is omitted because it would produce one unhelpful 100% row.
Read the current total and change. The analysis bar identifies the scoped total and its change against the preceding equal-length period. Every visible card uses that same period, scope and cost basis.
Read cost concentration. Cost by … is a horizontal ranking with full labels, amount and share of the total. It shows the leading values and one reconciled Other row. Other is a roll-up, so it cannot be selected as though it were one Ledger value. Break down by Region to use the existing map view when location is the clearer answer.
Show cost as a rate in demo mode. Per customer divides the sample cost by the demo customer count. Deployed workspaces show total cost only because CloudMonitor does not yet have a live customer denominator; the control is hidden rather than presenting an invented rate.
Follow one value
Section titled “Follow one value”Select a named row in either summary card. The same value becomes selected in both cards and opens the context for Guided drill-down. The selected summary shows its cost and share, and the breadcrumb keeps the current path visible.
Use Split further by to choose the next searchable dimension. Explorer initially shows the five largest child values with cost and share of their parent. Show more reveals the remaining compact set without turning the first view into a large tree.
Select a child to extend the breadcrumb. Open in The Ledger carries the complete selected path, so the table opens on the exact lines behind the investigation instead of only its first value.
If the bill read is capped, Explorer says so. Narrow the Period or scope before treating the compact ranking as complete.
Saving your work
Section titled “Saving your work”The Explorer expects you to build something worth keeping.
- Save current as… names the analysis.
- Update ”…” overwrites it after you’ve tweaked it.
- Reset to default starts over.
- Saved analyses lists everything you’ve kept.
Saved analyses are per-report and shared across the workspace. The page address follows the active analysis, so a link you copy opens on the same analysis. Deleting one removes it for everyone using it.
When to use it, and when not to
Section titled “When to use it, and when not to”Use the Explorer for exploratory work and for a recurring analysis you’ll want again next month. The demo-only rate view is useful for illustrating a per-customer question, but it is not live unit economics.
Use the Ledger when you need to reconcile a number to the bill line by line, or drill from a total to a single resource. It’s the better tool for tracing.
Filters
Section titled “Filters”Every global filter applies, plus your cost basis. A named Explorer analysis saves the analysis shape: grouping, chart, rate setting and drill-down path, but not the top-bar filter selections.
In demo mode, be deliberate about the Period when comparing the per-customer sample rate: seven days and a quarter are different measurements.